Hey everyone, I finished up the documentation and code to implement a full monitoring stack, including proactive alerts. The resulting guide (links below) will enable you to easily set up the same system for your own use.
Please feel free to provide critique/feedback here or via Github issues. Mike and I will be holding an office hours to demonstrate the installation process on Wednesday, February 15 @ 10am Eastern. Join us to see it live.
Many thanks to @MikeZupper and @Authority_Null for supporting this effort.
Who is this guide for?
This guide is for Orchestrators who are looking to centrally manage Orchestrator operations and receive proactive notifications to avoid costly downtime.
A few benefits:
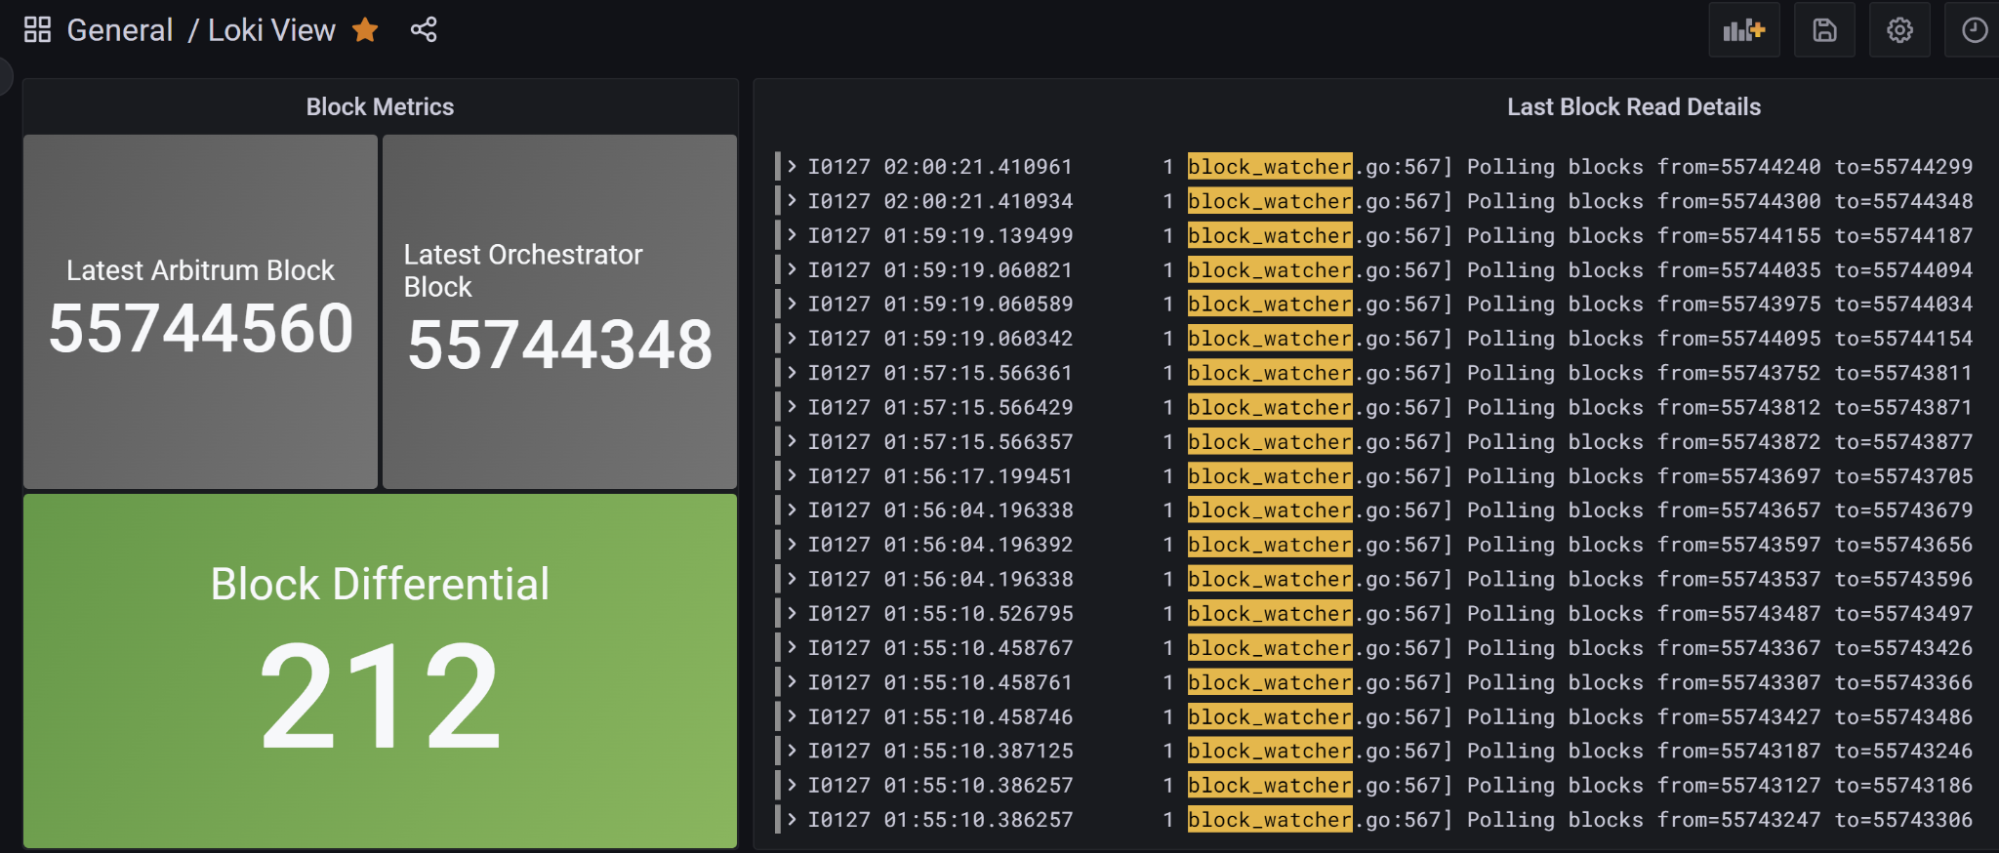
- A central management point for all Livepeer metrics and logs
- A publicly accessible and password protected Grafana dashboard
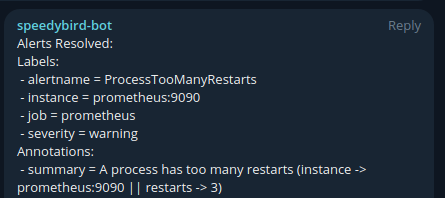
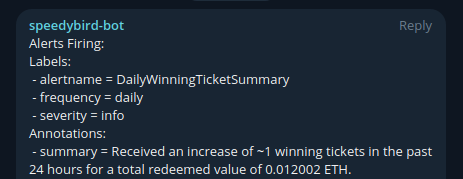
- Proactive Telegram alerts when your Orchestrator is unhealthy (e.g. Blockwatch failures, ticket redemption issues, etc)
- The ability to create new alerts and dashboards to monitor your system. There are many community dashboards out there that you can add on.
Sample Alerts and Dashboard
Components Used:
This project uses the Promtail, Loki, Grafana, Prometheus, Alertmanager, Traefik, and Docker Compose.
Project Code and Install:
The project can be found on Github here.
The install guide is also on Github here.