Solved For anyone who has the same issue, A clean reinstall of Grafana solves this.
—————-
Hello,
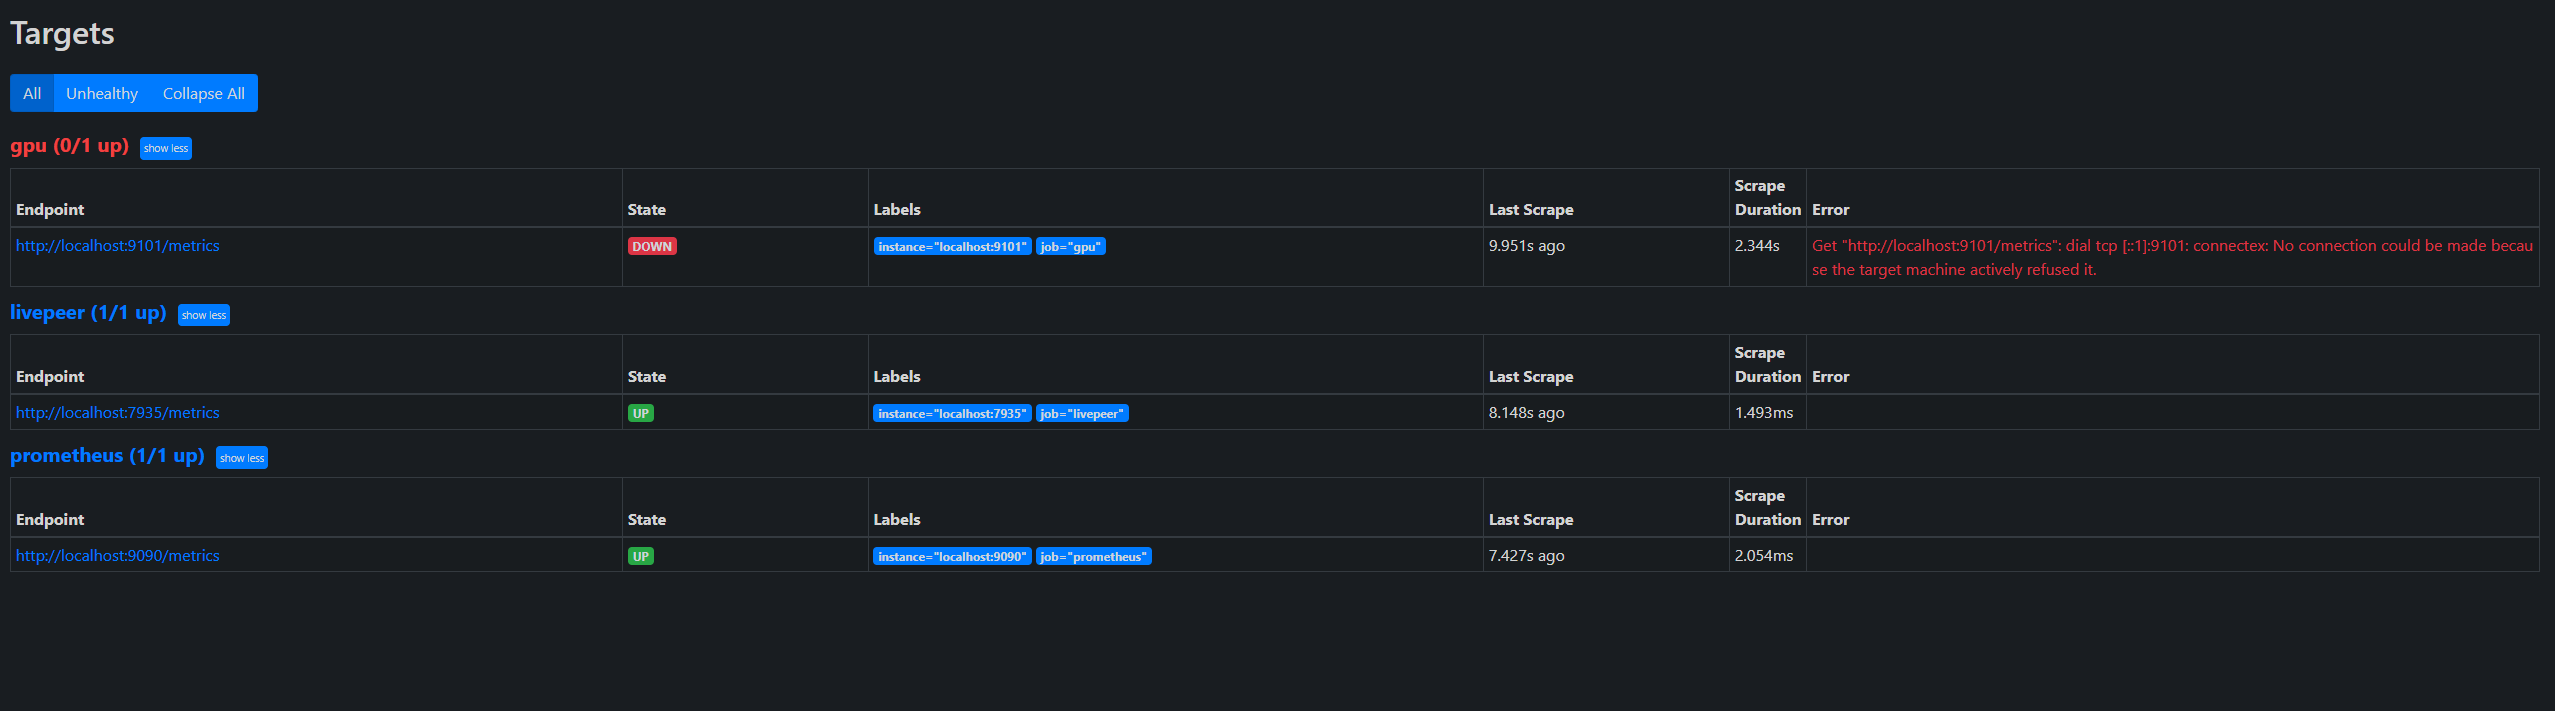
I’m unsure what caused this since everything was working up until yesterday. As you can see in the screenshots, the Orchestrator Overview panel is fine but the Payments Overview panel is completely broken.


If anyone can help me figure this out I’d really appreciate it.
